Description of the bioturbation module
sedflux implements one of two bioturbation modules. The first is diffusion-based while the second is a biological conveyor-belt. Both models are described in Boudreau, 1997.
Boudreau, B.P., 1997, Diagenetic Models and Their Implementation: Modelling Trasport and reactions in Aquatic Sediments: Berlin, Springer-Verlag, 414 pp.
Bioturbation as diffusion
The sediment column is divided into a series of layers. Organisms in the sediment are assumed to move sediment randomly either up or down. This results in the reworking of sediment being a diffusive process. Thus, for some sediment layer,
where \(t\) is time, \(z\) is burial depth, \(K\) is the biological diffusion coefficient, and \(u_i\) is the amount of sediment from the \(i\)-th layer. This processes is carried out for each sediment layer within some burial depth. Typically, this depth is around 10cm. Measured biological diffusion coefficients range from 10-100 \(cm^2/year\).
Bioturbation as a conveyor belt
In the conveyor-belt model, organisms move sediment from some depth and deposit it on the sea floor. Such a model is known as a non-local model as sediment jumps from one location to another. The current implementation of this model assumes a constant burial depth from which sediment is moved from and that it is transported at a constant rate, \(R\). Thus, over a period of \(Dt\), this process will mix an amount of sediment given by,
Typically, \(R\) is given in units of cm/day and is on the order of 1.
Example
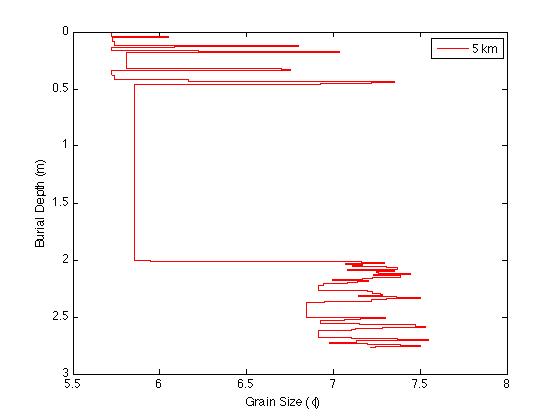
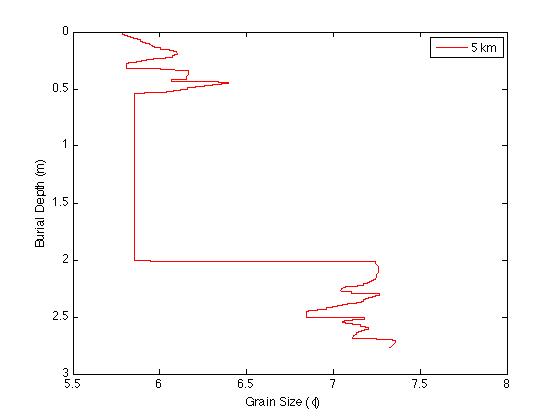
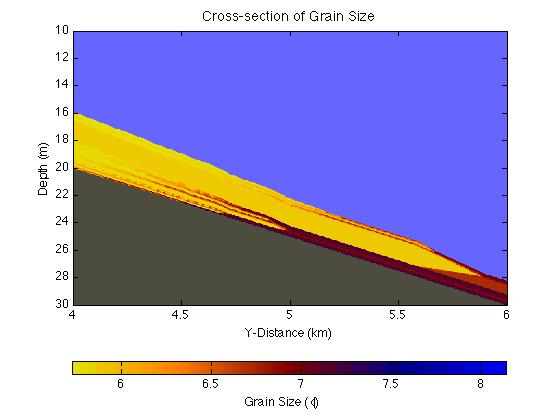
As a control, we deposit 20 years worth of sediment using a simulated daily time series of sediment discharge from the Eel River, California. The initial bathymetry is a linear slope that approximates the Eel River shelf. We then run the same simulation with the only difference being that bioturbation (diffusion) turned on (\(K=50 \rm{cm}^2 / \rm{y}\)). The following figures compare the grain-size profiles for the control (left figure) and diffusion (right figure) experiment.


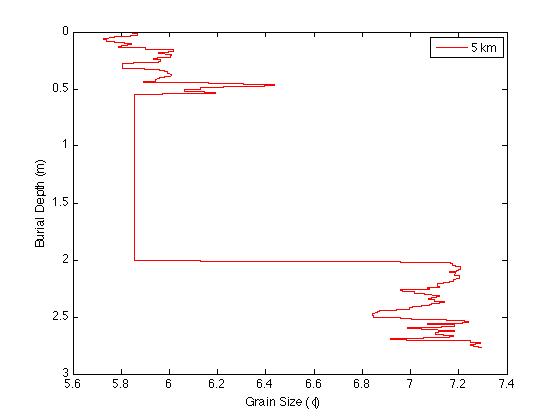
For further comparison, the following figures show grain size cores taken at y=5km for the same two simulations.